
At a high level, SQL queries use statistics and other variables to determine what execution plan to run. As a result, a given SQL statement (SQL ID) may end up having multiple execution plans (hash plans) over time. Depending on the execution plan selected at runtime, performance can improve or degrade accordingly.
Does this sound unpredictable? You bet. This can frustrate users and make them feel that the system or database is slow. However, by taking the proactive measures discussed below, system responsiveness can become stable and even the unthinkable: high-performing. You might even become a hero, who knows?
You may be wondering: how do these issues get discovered? A common way is for users to complain about a report running much slower than “normal.” As a DBA, your goal should always be to proactively identify any issue before someone shows up at your desk to complain (no one wants this to happen).
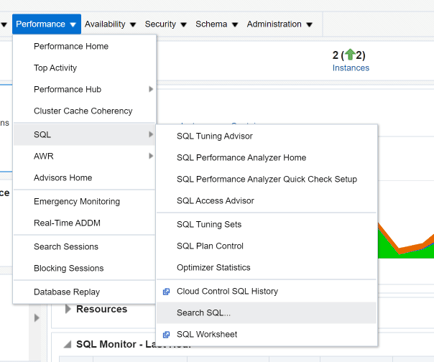
Oracle Enterprise Manager (OEM) is a key tool at a DBA’s disposal in helping to achieve this goal. A great place to start in identifying candidate SQL statements involves using OEM features like ADDM, Top Activity, or SQL Monitor to identify long running SQL Statements. You can then use Search SQL within OEM to find occurrences where potentially multiple hash plan values are used for the exact same SQL ID (see below).
You should focus on identifying hash plans where there is a clear “winner” with the least amount of elapsed time for SQL run time. If you can find a query that can be executed to get before/after timings, that is ideal since you can validate the results.
Below is a great example where SQL Baseline could be used to provide more consistent, optimal performance:
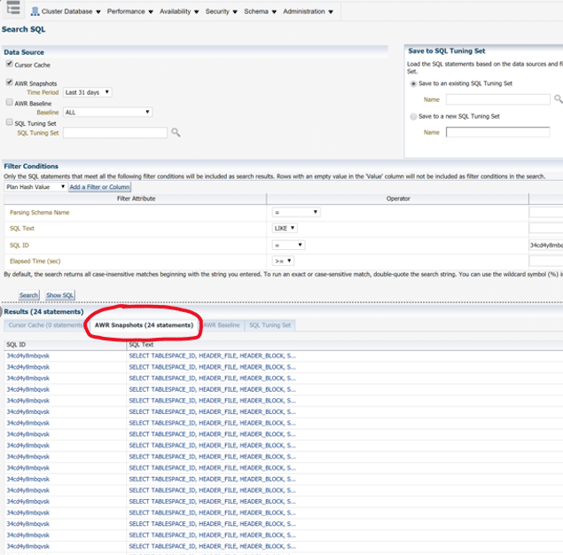
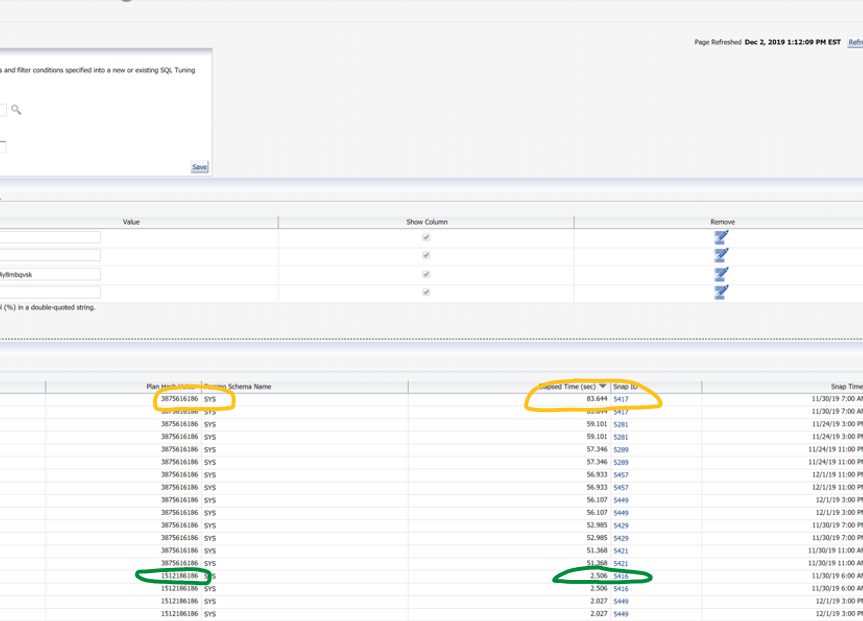
Notice that the AWR Snapshots tab (circled in red) was selected, providing a historical perspective on performance. Also, notice that the Plan Hash Value 3875616186 (circled in yellow) seems to always take at least 50 seconds whereas 1512186186 (circled in green) maxes out at 2.5 seconds. You’ll need the Snap ID associated with the faster hash plan to manually implement a SQL Baseline.
To use the commands provided below, you’ll want to record the SQL ID (34cd4y8mbqvsk), optimal Hash Plan Value (1512186186), and one of the Snap IDs (5416) for the optimal Hash Plan Value. Now, just plug these in.
1. Make sure you don’t have an existing tuning set with the specified name already in the database. If the statement errors, that means you don’t currently have a Tuning Set with the name TuneSet1 in place. The name is not important other than it needs to be consistent across all statements and can be reused with each attempt as long as it’s dropped first using this command:
BEGIN
DBMS_SQLTUNE.DROP_SQLSET(
sqlset_name => 'TuneSet1');
END;
/
BEGIN
DBMS_SQLTUNE.CREATE_SQLSET(
sqlset_name => 'TuneSet1',
description => 'SQL Tuning Set for loading plan into SQL Plan Baseline');
END;
/
DECLARE
cur sys_refcursor;
BEGIN
OPEN cur FOR
SELECT VALUE(P)
FROM TABLE(
dbms_sqltune.select_workload_repository(begin_snap=>5415,
end_snap=>5417,basic_filter=>'sql_id = ''34cd4y8mbqvsk''',attribute_list=>'ALL')
) p;
DBMS_SQLTUNE.LOAD_SQLSET( sqlset_name=> 'TuneSet1', populate_cursor=>cur);
CLOSE cur;
END;
/
DECLARE
my_plans pls_integer;
BEGIN
my_plans := DBMS_SPM.LOAD_PLANS_FROM_SQLSET(
sqlset_name => 'TuneSet1',
basic_filter=>'plan_hash_value = ''1512186186'''
);
END;
/
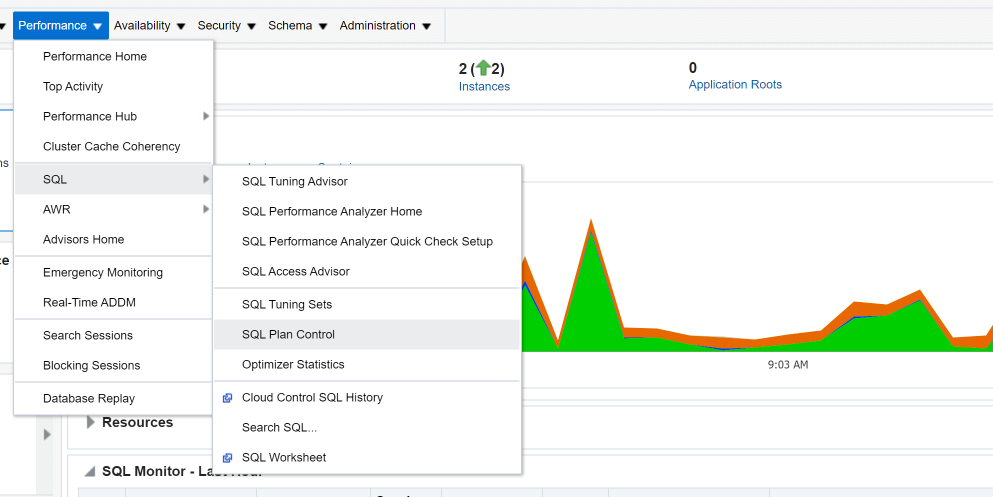
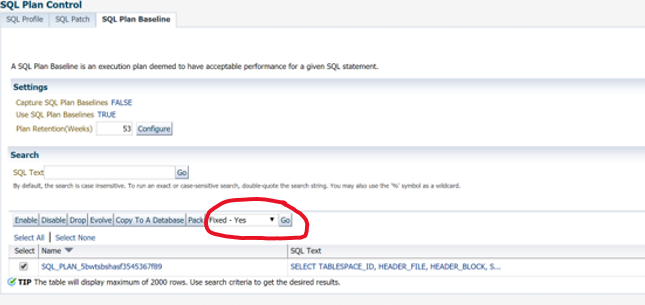
5. Once these commands run successfully, the last step is to make the Baseline “Fixed” so that it will be used going forward. The easiest way to do this is through OEM. For a given database, you’ll want to select “Performance,” “SQL,” and “SQL Plan Control” (below).
From there, click on the “SQL Plan Baseline” tab. Select the SQL Profile you just created manually and with the pulldown default of “Fixed – Yes,” click the “Go” button (circled in red).
That’s all there is to it. If you follow these steps, you can become a hero to your end user community and make for reliable, consistent system responsiveness.
Have questions or comments? Get in touch with us any time.