
Many database administrators (DBAs) face these kinds of perplexing questions and situations, putting them on the defensive and in a position where they have to prove the database is not the problem. To help avoid these situations and to enable DBAs for a more proactive approach, the use of operational metrics in analyzing system performance should serve as any DBA’s first line of defense.
Operational metrics allow DBAs to more rapidly identify trends and/or warning signs that serve as the basis for identifying the root cause of a performance issue. Conversely, metrics may clearly point out that database performance was “normal” during the time in question so other factors must be in play.
Typically, DBAs leverage Oracle Enterprise Manager (OEM) as the tool of choice for identifying issues and measuring performance by creating custom reports and alerts. While these methods serve a purpose, there are some limitations from an analytics perspective, particularly reporting through Information Publisher Reports.
OEM automatically aggregates data being displayed for a period of one month or longer resulting in a chart lacking any detailed data points. Below is an example of a report created through OEM (Figure 1), showing the CPU utilization for four databases (each color representing a given database) over the course of one month.
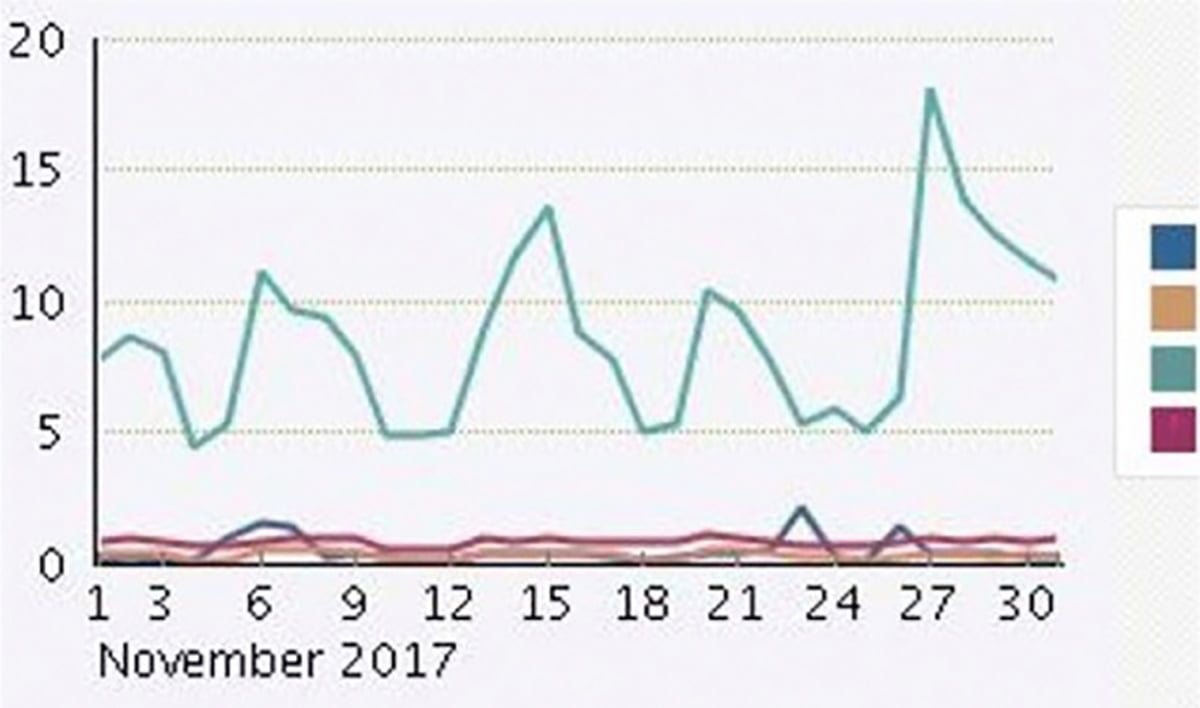
Figure 1 – Sample OEM report
The two main issues associated with OEM generated reports are:
- Lack of flexibility in the report attributes
- Limited granularity with the charts
When using Information Publisher Reports, what you see is what you get. The scale displayed on the charts can’t be modified and the colors selected to represent the line charts (in this case, databases) can’t be customized. As a result, trying to perform a comparison of two charts over separate periods of time can be an unnecessary challenge when the chart attributes don’t happen to align.
Oracle also decides what metrics to pull from based on the date range, so what we see in the example chart is a daily average of the metric then linked day by day. For example, a large CPU spike at 10am for a given day, may cause the utilization for the entire day to appear elevated instead of an isolated incident.
This lack of detail typically causes DBAs to do more detailed analysis which may not be necessary if sufficient details were originally provided on the charts. OEM does offer BI Publisher as a tool to generate a report. However this comes with a separate license and may not be appropriate unless there’s some in-house knowledge in using this tool.
On one project, we have a requirement to centralize the storage of all host logging. After carefully evaluating various Security Information and Event Management (SIEM) tool options, we selected Splunk due to a wide range of factors. Although the original intent was to use Splunk exclusively for server logs, we soon realized it would provide value and help with compliance by storing database audit table information while setting up alerts and reports to more fully utilize the tool.
After that proved successful, we took on the challenge of moving database operational metrics report to Splunk to see if it could serve as a viable option for replacing OEM reporting. The thought was Splunk could provide a more customizable and detailed version of operational metrics, improving the ability to more easily identify issues and the source of any problem. The customer would also have a clearer picture of the operating environment during a given timeframe as it relates to previous month’s metric results.
To setup Splunk for reporting the database metrics, OEM 13.2 must be installed and configured as Splunk relies on the OMS repository to pull in the metrics data for reporting. For our particular configuration, we installed Splunk 7.0.1 with the Splunk DB Connect App 3.1.1.
Step 1: Connect Splunk to Repository Database and Begin Digesting Data
For simplicity, we created a database user specifically for Splunk to use which was set up on all databases as part of this configuration. The below script was used to establish the account and allow the required permissions to the metrics. When creating the user, ensure the user is issued select privileges to the metric tables within the SYSMAN schema on the OMS Repository database, as found with the first set of grants (Figure 2).
CREATE ROLE SPLUNK_ROLE NOT IDENTIFIED;
-- Object privileges granted to SPLUNK_ROLE on OMS Repository only
GRANT SELECT ON SYSMAN.GC$METRIC_VALUES TO SPLUNK_ROLE;
GRANT SELECT ON SYSMAN.GC$METRIC_VALUES_DAILY TO SPLUNK_ROLE;
GRANT SELECT ON SYSMAN.GC$METRIC_VALUES_HOURLY TO SPLUNK_ROLE;
-- System privileges granted to SPLUNK_ROLE
GRANT CREATE SESSION TO SPLUNK_ROLE;
GRANT SELECT ANY DICTIONARY TO SPLUNK_ROLE;
GRANT SELECT ANY TABLE TO SPLUNK_ROLE;
CREATE USER SPLUNK
IDENTIFIED BY <password>
DEFAULT TABLESPACE SPLUNK_DATA
TEMPORARY TABLESPACE TEMP
PROFILE APPLICATION_SUPPORT_PROFILE
ACCOUNT UNLOCK;
-- 4 Roles for SPLUNK
GRANT CONNECT TO SPLUNK;
GRANT RESOURCE TO SPLUNK;
GRANT SELECT_CATALOG_ROLE TO SPLUNK;
GRANT SPLUNK_ROLE TO SPLUNK;
ALTER USER SPLUNK DEFAULT ROLE ALL;
-- 1 System Privilege for SPLUNK
GRANT UNLIMITED TABLESPACE TO SPLUNK;
Figure 2 – Oracle create script for splunk user
Once the user exists, a query will need to be created to pull the data by the Splunk user. Three tables store most of the metric data within OEM, which are located in tables that begin with a prefix of GC$Metric_Values. We decided to use the hourly values table but any of the available tables can be used, depending on your preference. Instead of showing you the whole list of metrics available (there are over 1,300 available metrics!) it is easier to run the below query (Figure 3) to explore the options.
select distinct entity_type, metric_column_label,metric_column_name from sysman.gc_metric_values_hourly order by 1,2;
Figure 3 – Oracle query for metrics
Our primary focus was on the entity types of ‘oracle_exadata’ and ‘oracle_database’ however, this query will show you the full range of what is available.
The final part of this step is to set up Splunk with the query (Figure 4) involved to pull the data from OEM.
SELECT entity_type, entity_name, metric_column_name, collection_time_utc, avg_value, min_value, max_value
FROM SYSMAN.GC$METRIC_VALUES_HOURLY WHERE ENTITY_TYPE IN('oracle_database')
and metric_column_label_nlsid in('wait_bottlenecks_avg_user_cpu_time_pct','instance_throughput_transactions_ps') and COLLECTION_TIME_UTC > sysdate - 2;
Figure 4 – Oracle select query two
In order to get the query set up in Splunk, you will need to log into the DB Connect App and create a source name. The next step is to input the SQL Query (Figure 5) as well as connection information. The specific tables in OMS do not have a rising column so as an input type, select the “Batch” option.
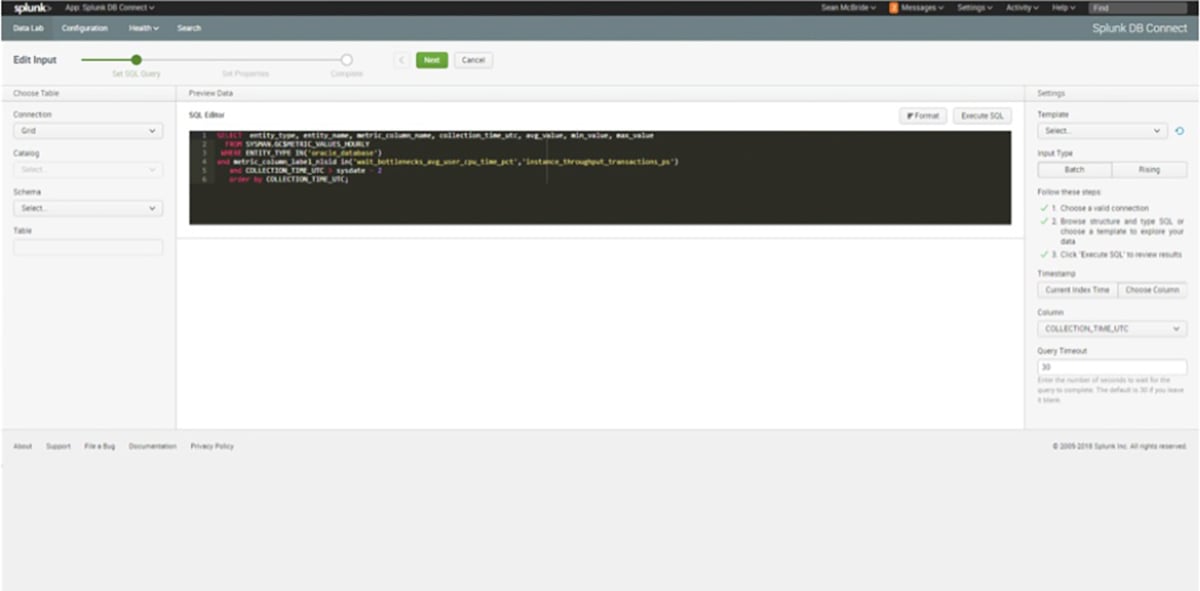
Figure 5 – Splunk query configuration, Part 1
On the second step of the configuration (Figure 6), we select how often to run the query as well as the number of rows to retrieve from each run. This is also where we name the source and index for the query, which is important for dashboard creation. Our base query brings in all data from the past two days so we are only running the batch once a day.
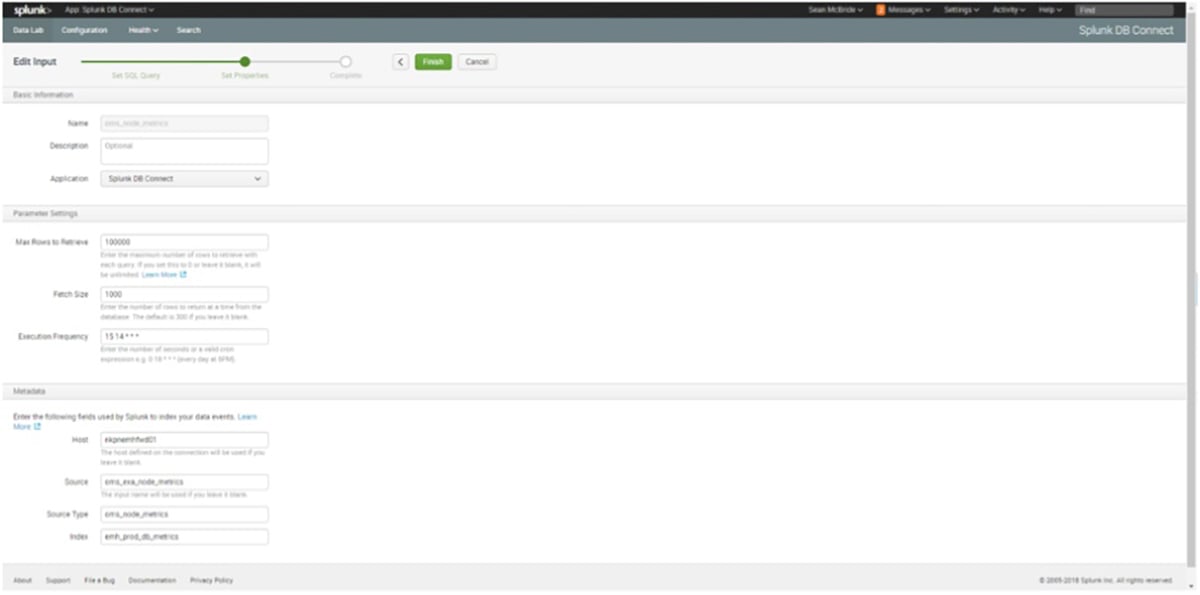
Figure 6 – Splunk query configuration, Part 2
Step 2: Design and Create Splunk Dashboards
Upon validating the data was being properly ingested, we worked on designing the dashboards.
Our goal was to mimic the Oracle design which resulted in tweaking the query (Figure 7) used for the dashboard. Note the index and source values, these are the ones that we created in a prior step.
index=emh_prod_db_metrics source="oms_exa_node_metrics" METRIC_COLUMN_NAME="avg_user_cpu_time_pct" ENTITY_NAME=*1 | eval db = ENTITY_NAME | timechart span=1h avg(AVG_VALUE) by db
Figure 7 – Splunk search expression for the metrics
This created the below dashboard (Figure 8)
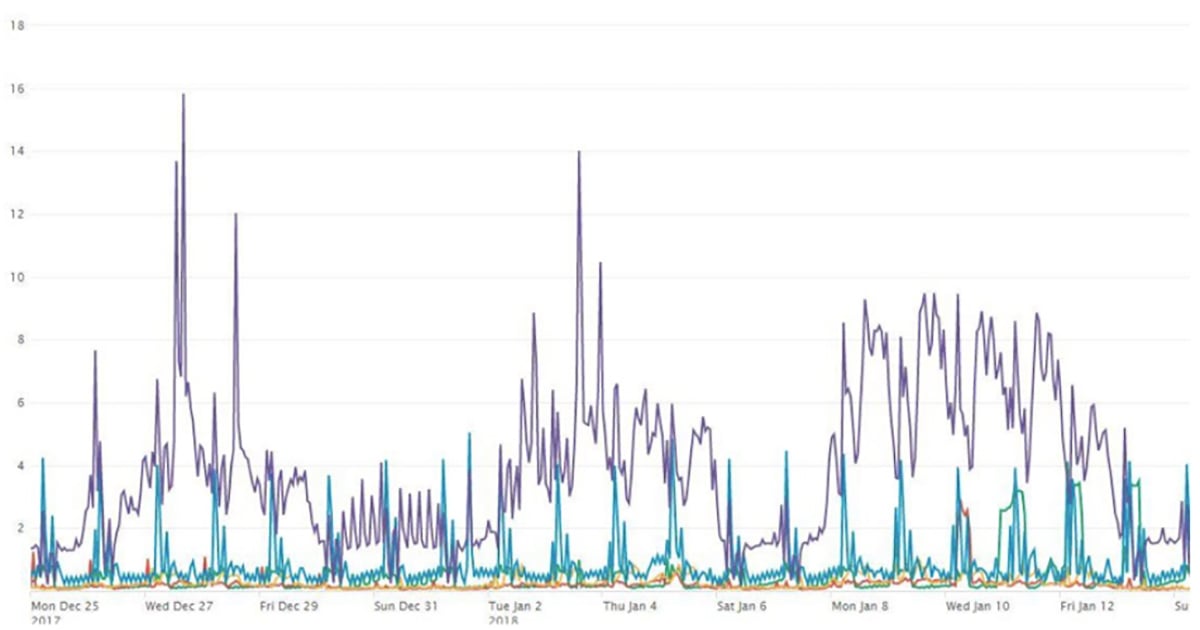
Figure 8 – Sample splunk report
The end result is a much cleaner and detailed result set. We can now drill down to the hour level and see the underlying data as well. The overall flexibility Splunk’s reporting capability provides has been a huge boost to identifying potential issues and identifying the root cause. In addition, the use of Splunk to display operational metrics broadens the customer experience to support more granular reporting while helping to avoid any unnecessary finger pointing.